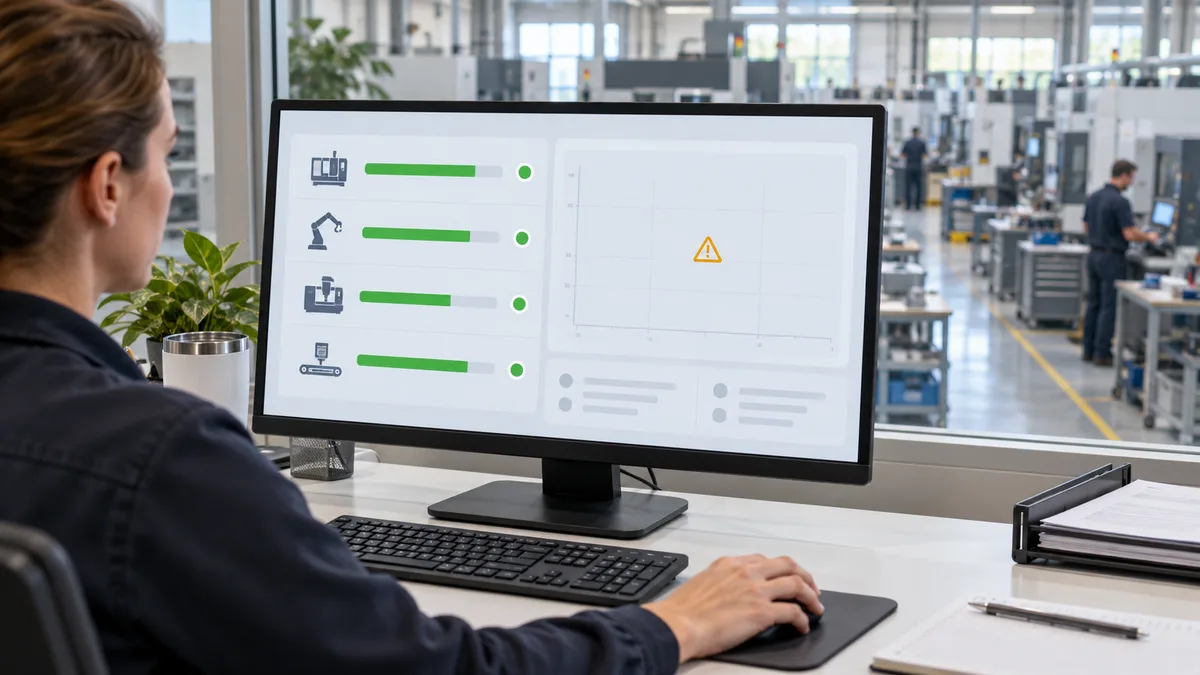
Manufacturing dashboard software should show zero alerts only when the required data is current, the selected scope is complete, and the checks actually ran. A blank exception list after a failed connection is not evidence that production is on track. Ask the supplier to demonstrate the difference before you rely on the screen for a shift meeting.
This guide is for small manufacturers evaluating operational reporting, with US buyers in mind and the same test applicable to factories in India and elsewhere. It covers business dashboards, not machine safety systems or industrial control alarms. Run the demonstrations with simulated records in an isolated test environment, never by disconnecting live equipment or production networks.
Separate the result from the ability to check
A dashboard has two different questions to answer: are there known business exceptions, and can it currently evaluate the relevant records? Do not squeeze both answers into a single green indicator.
- Checked, no exceptions: the complete expected scope was evaluated successfully against current data and nothing matched the exception rules.
- Checked, exceptions found: show the matching jobs or holds, their owners, and when they were evaluated.
- Not fully checked: a source failed, data is too old, a required department is missing, or the rule did not run. Show what is unknown alongside any last-known results.
- Not applicable: the process is deliberately outside the monitoring schedule or scope. Identify the reason; do not silently present this as a successful check.
Product terminology varies. For example, Grafana-managed alert rules distinguish a query that succeeds but returns no data points from an evaluation error, and allow their handling to be configured. That is a useful reminder to inspect settings, not assume an empty panel is healthy. See Grafana's No Data and Error documentation.
An exception-only query returning no rows can legitimately mean zero exceptions, but only if a separate check proves that the expected input records were available. A successful database connection alone does not establish that.
Write a small data-coverage contract
Before the demo, choose one decision: whether a supervisor has a complete view of open quality holds for today's scheduled jobs. Specify the plant, work centers, job population, timezone, rule version, and who may change the filter. The manufacturing dashboard planning guide can help choose the decisions and owners first.
For each required source, record the expected update method, maximum acceptable age, and evidence of a complete update. A scheduled snapshot can report its source observation time and coverage even when there are no holds. An event-only feed needs another way to establish completeness, such as a reconciled checkpoint; silence does not prove that there were no events.
Set freshness limits with the process owner. A daily planning extract and a minute-by-minute exception list have different needs. Distinguish the time the source was observed, the time the import succeeded, and the time the rule evaluated it. Show the user which one a displayed timestamp means.
Refreshing the screen is not necessarily refreshing its underlying data. Microsoft's Power BI refresh guidance explains that refreshed visuals using imported tables query data already in the semantic model. Ask what your proposed dashboard actually refreshes rather than relying on a moving clock.
Demo: three known holds, then a missing source
Hypothetical acceptance test: a factory has separate production and quality snapshots. Each is expected once a minute during the shift, including an explicit complete snapshot when its exception count is zero. For this test only, data becomes stale when its source observation is more than three minutes old. Times below are October 23, 2026, in America/Chicago. These are invented test records, not customer results or a recommended universal refresh interval.
- 09:00: both snapshots arrive complete. Production has no late jobs; quality has three open holds. The screen shows zero late jobs and three holds, with both sources current.
- 09:01: simulate a quality-feed failure. Production continues to update. The dashboard must not replace the quality result with zero because its query failed.
- 09:04: the last quality observation is now four minutes old. Show three last-known holds, the 09:00 source time, and an explicit unknown-current-status warning. Production can remain current, but the combined view is incomplete.
- 09:05: retry delivers the old 09:00 snapshot. Its receipt time is new; its business observation is not. Quality must remain stale.
- 09:06: a complete, valid current snapshot arrives with two holds. Only after successful evaluation should quality return to a current state. The source record, not reconnection alone, must explain the closed hold.
Capture the screen and the underlying source, import, and evaluation records at each step. The pass condition is not merely that an amber icon appears: the displayed count, scope, age, and recovery behavior must all agree with the test evidence.
Test partial coverage and empty filters
Next, remove one expected work center from the test snapshot while leaving the connection successful. A plant-wide zero must not appear if one department was never checked. Show which part of the scope is missing and keep confirmed results for the available departments distinct.
Repeat with a filter that selects no jobs. The useful response is that the selected scope contains no eligible jobs, not that the whole plant has no problems. Try the same view with the supervisor's actual permissions: a user who cannot see quality records should not receive a reassuring zero derived from that restricted view.
Also test a legitimate off-shift interval. An agreed monitoring calendar can explain why new samples are not expected, but it should not hide an unexpected outage once the next shift starts. Keep the calendar's timezone explicit. Do not solve a noisy test by globally suppressing all missing-data warnings.
Keep recovery separate from resolution
Restoring a connection answers a technical question. Closing a quality hold answers a business question. Require separate evidence for each. A supervisor acknowledging an outage warning should not erase the original holds, and acknowledging a hold should not mark the source healthy.
Ask how the system handles records queued during the gap. It should identify the last complete checkpoint, process the intended backlog, and reconcile the result before claiming full coverage. The first ERP integration guide covers record ownership and replay checks in more detail. Do not infer that missing events never happened simply because the latest connection succeeded.
If counts disagree after recovery, investigate the input set and calculation rather than hiding the difference. Use the separate dashboard output-totals reconciliation test for duplicates, shift boundaries, and late entries. This missing-data test establishes whether the result can be trusted as current; it does not prove the calculation is correct.
Verify that the warning reaches its owner
A correctly evaluated warning can still fail to reach anyone. In the test environment, route notifications to a designated test address and simulate a delivery failure separately from the data failure. Check that the support owner can see unsuccessful delivery and that the dashboard still displays the underlying problem.
Assign a data owner who can investigate the source, an operational owner who decides what work can proceed with incomplete information, and a named fallback contact. Agree how repeated messages are grouped without hiding a continuing outage. These are proposed acceptance requirements to discuss with the supplier, not claims about features in every reporting product.
Take this checklist to the software demo
- Can we distinguish a confirmed zero, an empty selection, a failed check, and a deliberately unmonitored period?
- Does every important result identify its scope and source observation time?
- Will an old replay remain stale even if it arrived just now?
- Does a missing department prevent an unjustified plant-wide all-clear?
- Are known exceptions retained as last-known facts during an outage?
- Can we trace recovery to complete current data and successful evaluation?
- Can the responsible person discover a notification failure?
Ask the supplier to run these cases on your agreed test data and attach the results to the pilot acceptance record. A reassuring screen is useful only when everyone knows what it actually checked.
Can your dashboard explain an empty alert list?
Share the decision, data sources, and reporting gaps you want to address with Ploqy Technologies. Start a discussion about a manufacturing software requirement that fits your workflow.
Continue with a related guide
- Plan a useful manufacturing dashboard
- Reconcile dashboard output totals
- Test your first ERP integration
Manufacturing software servicesManufacturing website servicesDownload the project checklist
Published by Ploqy Technologies. About our guides and editorial process.