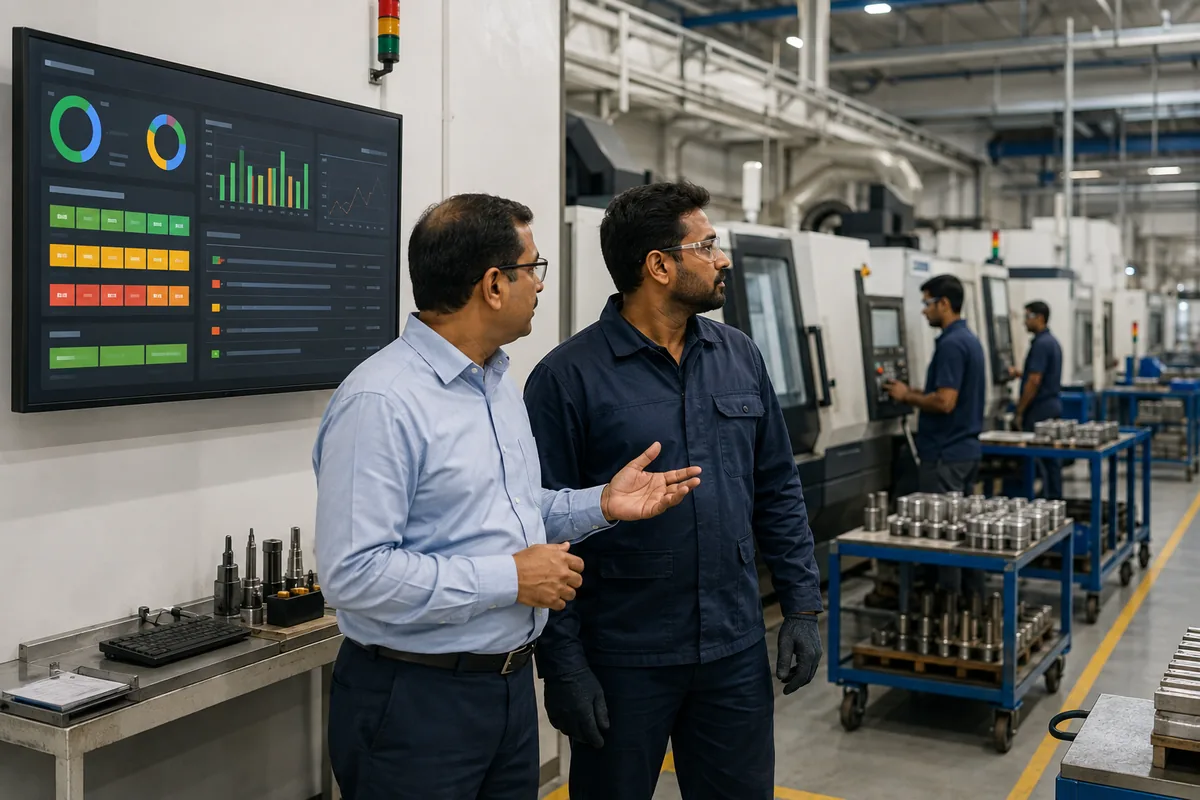
Factory owners rarely need another screen filled with charts. They need a dependable view of customer commitments, production status, material risk, quality holds, and problems that require a decision today. When those facts live in separate spreadsheets and messages, a morning review becomes a long exercise in collecting and reconciling updates.
A manufacturing dashboard for small business should bring the important signals into one operating view without hiding their source. The first version can be compact. Its value comes from clear definitions, current data, visible exceptions, and a direct connection to action.
Start with daily decisions
List the decisions the owner or production head makes during an ordinary day. Which customer orders need intervention? Which jobs are behind or blocked? Which materials threaten the next schedule? Which quality holds affect dispatch? Which breakdown or absence requires a new sequence?
For every decision, identify the minimum signal, the person responsible for the underlying process, and the action that follows. Do not add a chart only because data is available. A dashboard element should support a question that someone is expected to answer.
Use three levels of information
A practical dashboard separates information into three levels:
- Current position: a small set of headline indicators showing whether delivery, production, material, and quality are broadly on course.
- Exceptions: delayed orders, blocked jobs, shortages, holds, overdue actions, or unusual changes that need attention.
- Detail: the orders, jobs, materials, operations, and records that explain an exception.
This structure lets the owner scan the factory quickly and investigate without opening a separate report or asking someone to recreate the numbers.
Show delivery risk first
Customer commitments provide the clearest business context. Show orders due within the chosen horizon, their current production and dispatch readiness, and exceptions that threaten the committed date. Separate work that is late, at risk, on course, and awaiting an external decision.
A delivery-risk view should connect the order to unfinished jobs, missing material, quality hold, subcontract status, or approval. Avoid showing only total sales order value or dispatch quantity; those totals do not explain which commitment needs attention.
Summarise production against the plan
Show planned versus completed work for the current shift or day, important WIP, blocked operations, and capacity constraints. Use the same schedule that supervisors are expected to follow. The production planning software guide explains how demand, readiness, capacity, and shop-floor progress form that shared plan.
Allow the owner to move from a missed target to the responsible work centre, job, operation, and reason. Our guide to production tracking metrics provides a broader set of measures; the daily dashboard should display only the few needed for immediate control.
Expose material risk before jobs stop
Highlight shortages affecting released or near-term jobs, overdue purchase actions, important receipts awaiting inspection, and stock discrepancies that block the plan. Group alerts by affected production rather than presenting a long list of items below reorder level.
Each alert should show required date, usable quantity, expected supply, affected jobs, owner, and next action. The guide to material shortage alerts describes how time-phased demand and supply create a trustworthy signal.
Keep quality status connected to flow
Show open quality holds, rejected or rework quantities that affect active orders, overdue disposition, and repeated defects that need investigation. Quality information belongs beside the affected job or material, not in a disconnected departmental total.
Link the exception to its inspection evidence, current location, affected quantity, and decision owner. A controlled workflow for digital quality inspection records helps keep these details current and traceable.
Include only actionable resource constraints
Show machines, tools, teams, or subcontract operations that currently affect the schedule. Planned maintenance, an unresolved breakdown, unavailable tooling, or a missing skill can be meaningful. A complete equipment catalogue is not a daily dashboard.
Connect the constraint to the waiting jobs and the current recovery action. This helps the owner decide whether to change sequence, shift work, expedite support, or revise a commitment.
Give every indicator a stable definition
Document the formula, source transactions, included statuses, time boundary, unit, owner, refresh frequency, and meaning of each colour. Define terms such as completed, on time, released, available, blocked, and rejected. Small differences in these definitions can produce conflicting discussions.
Display the data timestamp and relevant filters. Users should know whether a value covers one shift, the current day, the month, one plant, or all work centres. If the definition changes, record the effective date and explain the impact on comparison.
Match data freshness to the decision
Not every signal needs continuous refresh, but it must be current enough for its use. Shop-floor progress may need shift or event updates. Purchase commitments may change when a supplier date is confirmed. Monthly trends do not need to distract from a live exception view.
Late transaction entry creates false alarms and false confidence. Design short reporting steps into the digital job card, stores, purchasing, and quality workflows. Show when source data is stale rather than presenting an old value as current.
Keep the visual design quiet and precise
Use a restrained colour system: normal, attention, urgent, and unavailable or unknown. Reserve strong colour for conditions requiring action. Keep labels clear, units visible, and trends on consistent time scales. Tables often work better than charts for a short list of specific exceptions.
Avoid decorative gauges, crowded pie charts, tiny labels, and automatic scrolling that prevents careful reading. Design for the actual display, whether it is a wall screen, desktop, tablet, or phone. The same data may need different arrangements for each context.
Create role-specific views from shared data
The owner may need delivery risk and major constraints. A production supervisor needs today's sequence, blocked jobs, and progress. Purchasing needs shortages and supplier actions. Quality needs holds and pending decisions. These views should use the same definitions and records while presenting different priorities.
Do not create separate manual datasets for each role. Shared data with controlled filters prevents meetings from becoming arguments about which report is correct.
Connect the dashboard to a review rhythm
Use the dashboard in a short daily control meeting. Review new or worsening delivery risks, incomplete planned work, near-term shortages, quality holds, and resource constraints. Assign or confirm the owner, action, and due time inside the connected workflow.
Move longer trend analysis and improvement work to a weekly or monthly review. Mixing strategic analysis with every urgent shop-floor exception makes both discussions less effective.
Pilot one decision loop
Choose one area, such as delivery readiness for a product family or daily control of a constrained work centre. Agree on the indicators, definitions, source transactions, refresh timing, exception thresholds, and owners. Build the summary, exception list, and drill-down together.
Test normal work, partial completion, a late material receipt, quality hold, breakdown, priority change, stale update, and corrected transaction. Run the dashboard during real meetings until the team can trust the signal and complete actions without maintaining a second list.
Begin with one screen and one meeting
Observe the current daily production meeting. Note every spreadsheet opened, message requested, number disputed, and action written elsewhere. Select the few decisions that matter most and design one shared view around them.
A good manufacturing dashboard does not replace management judgement. It gives that judgement reliable context and makes exceptions easier to own. Once the first decision loop works, add another view only when it supports a clear responsibility and action.
Want a practical daily factory dashboard?
Share the reports used in your current production meeting and the decisions that still depend on calls or messages. Ploqy Technologies can help map a focused dashboard around trusted data, exceptions, owners, and daily actions.